
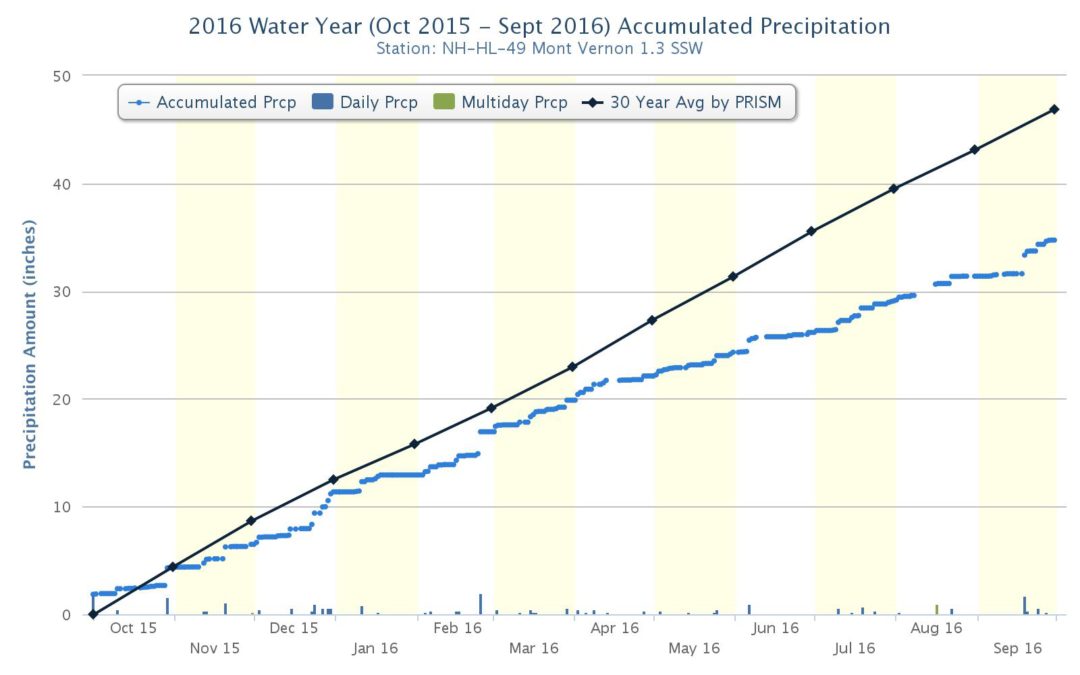
The chart above is the water year (October to October) chart of precipitation I’ve measured at my house for CoCoRaHS. The solid line is the estimated 30-year average, based on long-term measurements nearby.
The dryness started in April of 2015, as this chart from the previous water year (2014-2015) shows:
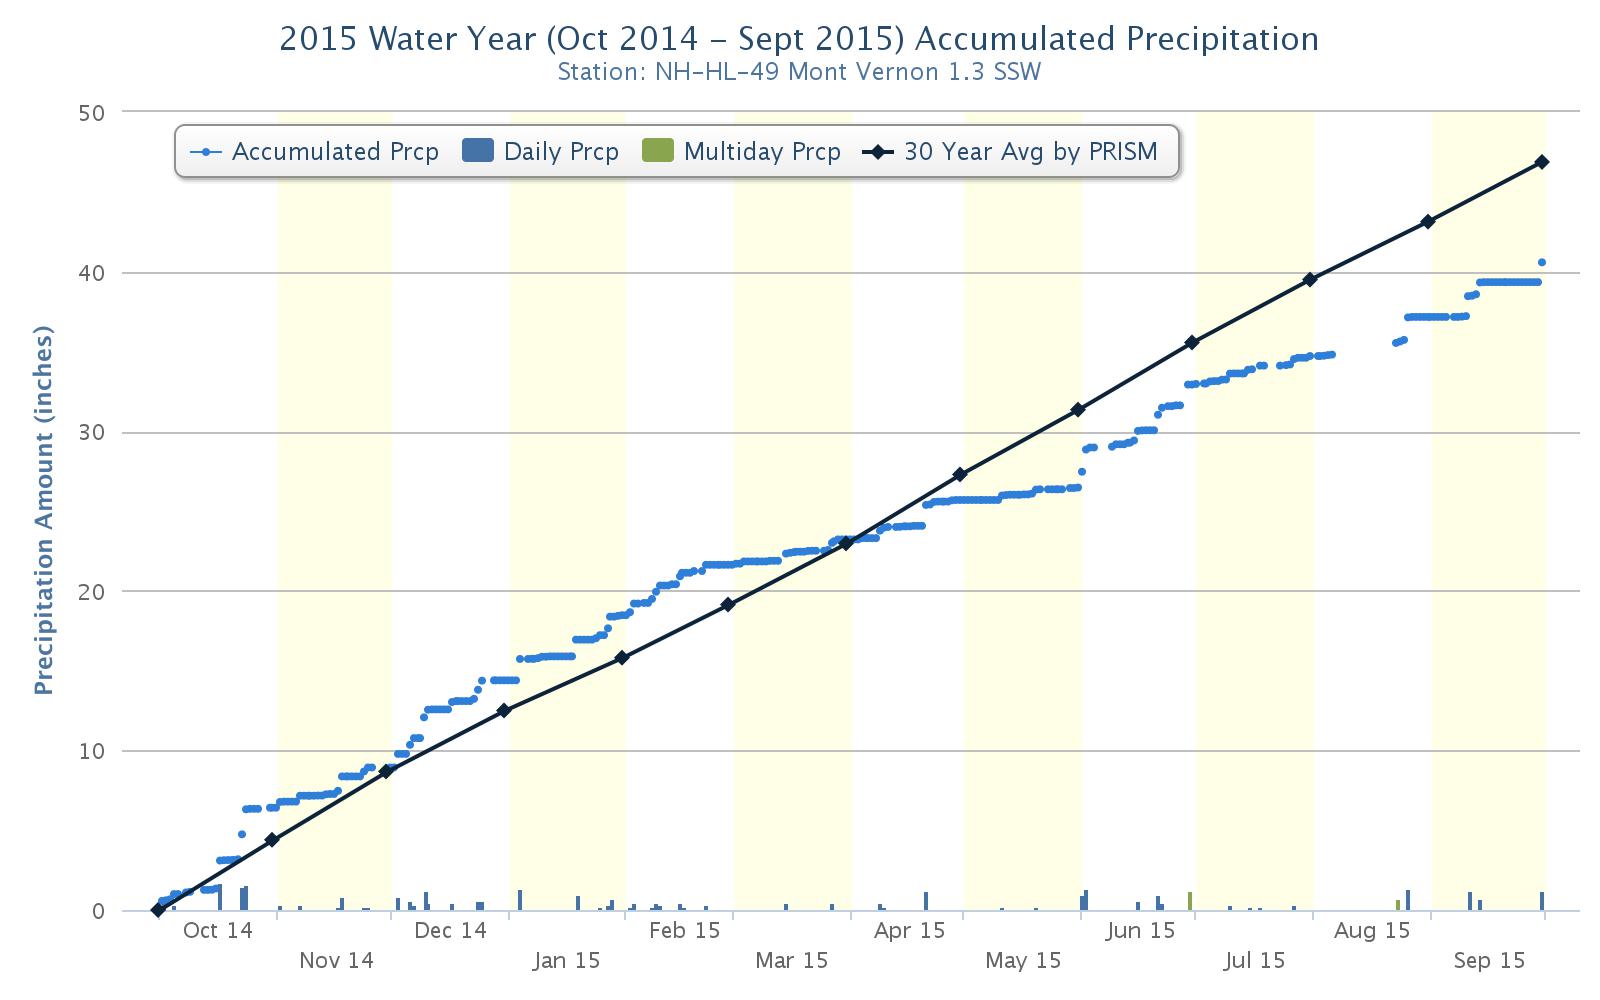
Precip. (rain/snowmelt) at my house vs. 30-year average, Oct. 2014 to Oct. 2015
 Return to the Concord Monitor