
image002
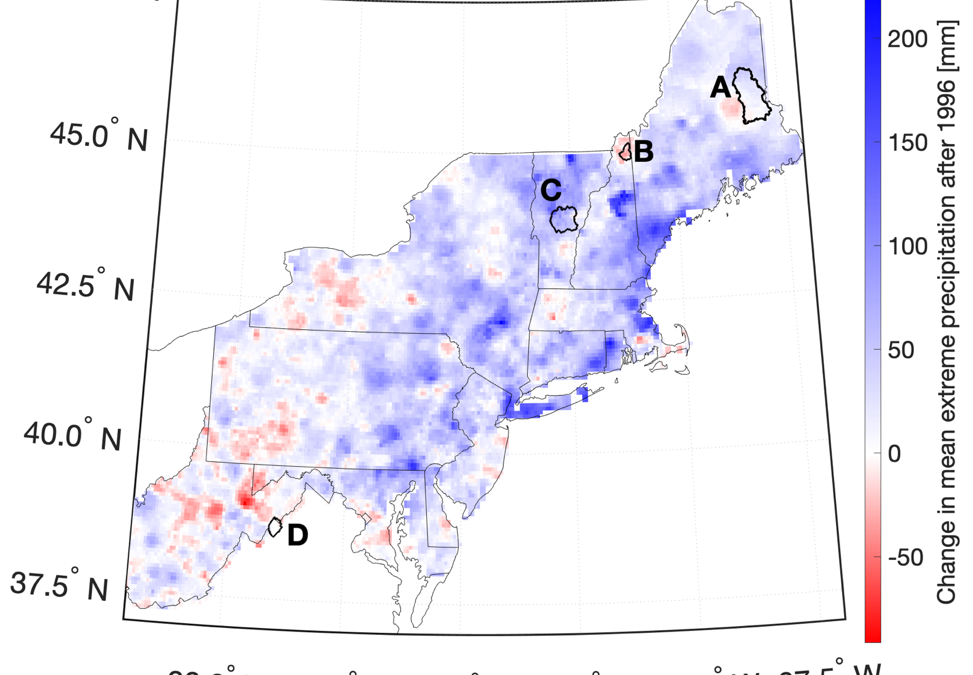
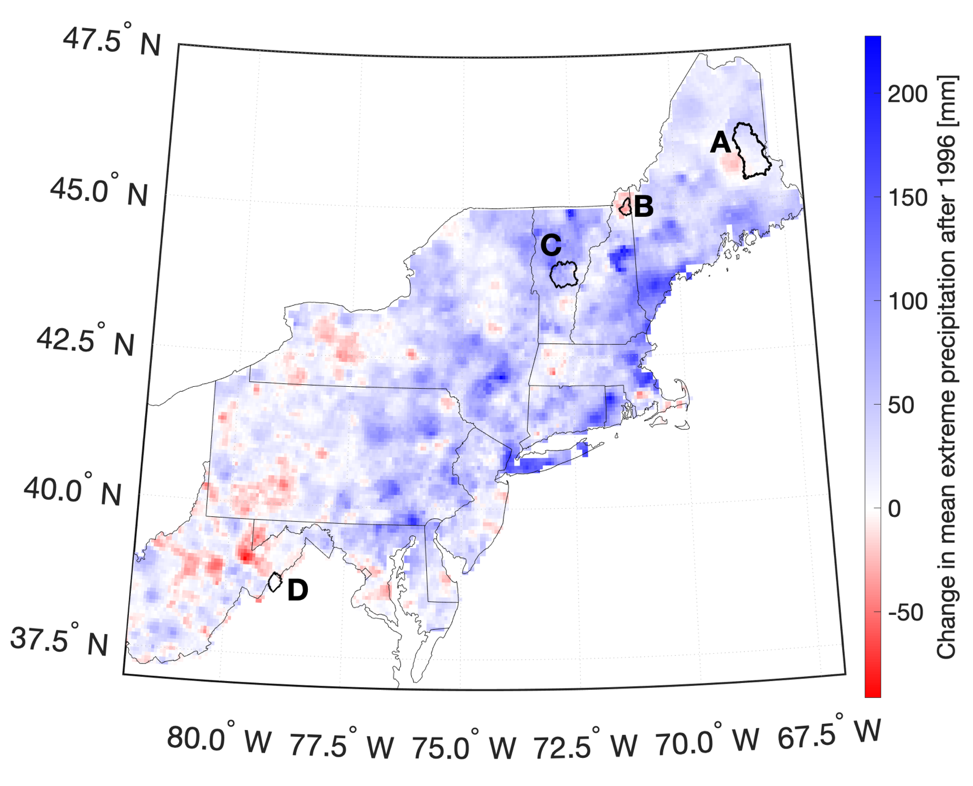
Map showing the average change in annual extreme precipitation 1996-2011 compared to the 1979-1996 average. Watersheds analyzed are outlined in black: (A) Mattawamkeag River in Maine, (B) Dead Diamond River in New Hampshire, (C) White River in Vermont, and (D) Shenandoah River in West Virginia. Figure by C.Cockburn et al.
 Return to the Concord Monitor