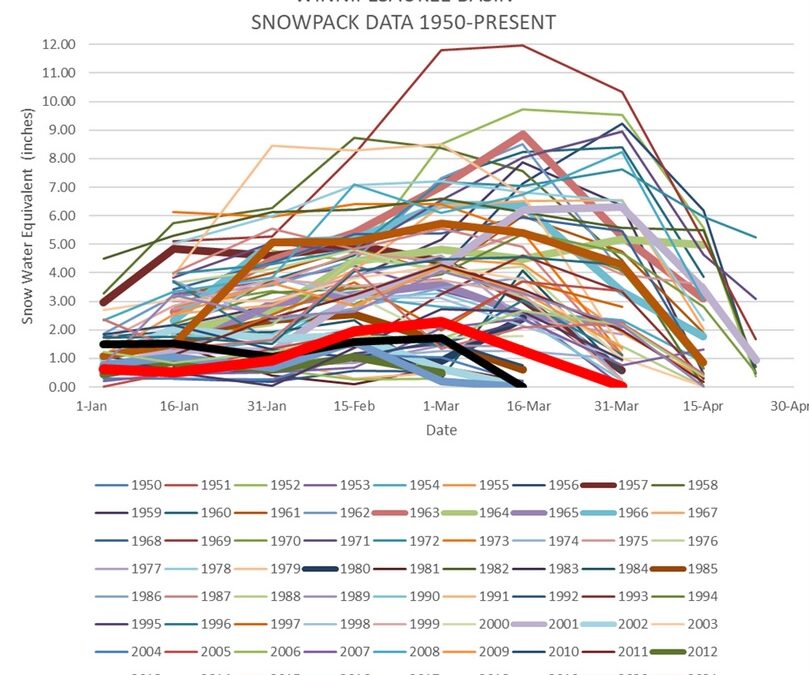
Last year's drought started because of less snowpack than normal (thick black line at bottom). This year is almost as bad (thick red line). Source: Water Division for New Hampshire
Dave Brooks has written a weekly science/tech newspaper column since 1991 – yes, that long – and has written this blog since 2006, keeping an eye on geekish topics in and around the Granite State. He discusses the geek world regularly on WGIR-AM radio, and moderated the monthly Science Cafe NH sessions when they were still a thing. He joined the Concord Monitor in 2015.
Brooks earned a bachelor’s degree in mathematics but got lost on the way to the Ivory Tower and ended up in a newsroom. He has reported for newspapers from Tennessee to New England. Rummage through his bag of awards you’ll find oddities like three Best Blog prizes from the New Hampshire Press Association, Writer of the Year award from the N.H. Farm and Forest Bureau (of all places) and his 2024 induction into the New England Newspaper Hall of Fame.


 Return to the Concord Monitor