
Interactive maps showing the effect of sea-level rise on coastal areas have been around a while – they’re pretty easy to create if you’ve got the right tools, thanks to detailed topographic data – so the release of a new one by Climate Central isn’t a big deal. But I checked it out anyway, plugging in various New Hampshire locales, including Seabrook.
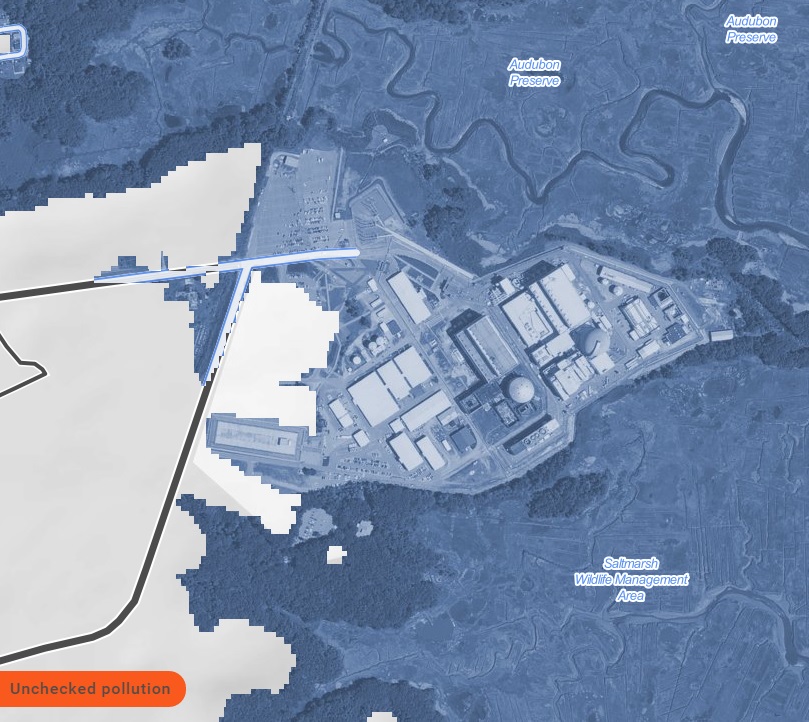
And there, in startling blue reality, I saw all of Seabrook Station nuclear power plant awash by 2100 as part of a worst-case scenario, which includes a whopping 23 feet in global sea rise. I’ve put a screen shot above; you can play with the map here.
Even if this comes true, it’s a bit less alarming than it sounds because by 2100 Seabrook will have almost certainly stopped operating due to age. However, it’s still bad: unless we’ve established a national spent-nuclear-fuel repository by then – yeah, right – Seabrook will have tons of spent but incredibly radioactive fuel stored in dry casks that will have to be moved somewhere else.
It won’t be alone in this need, either. Many of the world’s nuclear plants are located on coastlines to use ocean water for cooling. They’re all going to face this possibility, many of them well before Seabrook Station.
Details about the worst-case scenario from the website: “Technically, this option corresponds to a scientific scenario called RCP 8.5, which carbon pollution has been tracking closely so far. RCP 8.5 implies we emit a total of 2,430 gigatons of carbon by 2100 (or 3.67 times that weight of CO2). That corresponds to 5.9 °F (3.3 °C) of eventual warming, and 23.3 feet (7.1 meters) of global sea level rise locked in to some day take place. These are central estimates within wider possible ranges, as are the further estimates in this section below. Note that in RCP 8.5, annual emissions are still rising in 2100, so locked-in sea levels will continue to increase. However, these maps and the analysis do not account for further pollution past 2100.”
 Return to the Concord Monitor