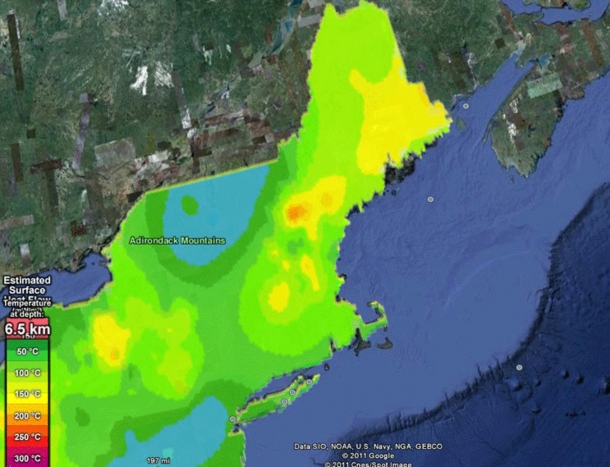
A portion of a 2011 analysis of geothermal potential in the U.S., with colors showing estimated temperature 6.5 kilometers below the surface. The orange spot in N.H. is the Conway area.

A portion of a 2011 analysis of geothermal potential in the U.S., with colors showing estimated temperature 6.5 kilometers below the surface. The orange spot in N.H. is the Conway area.
 Return to the Concord Monitor