
When my 5 kW rooftop solar system kicks into gear most of what it does is reduce my power usage, although on a day like yesterday – 35 kWh, the equivalent of 7 hours of full production thanks to cool weather and a sunny day! – it sends some electricity into the grid.
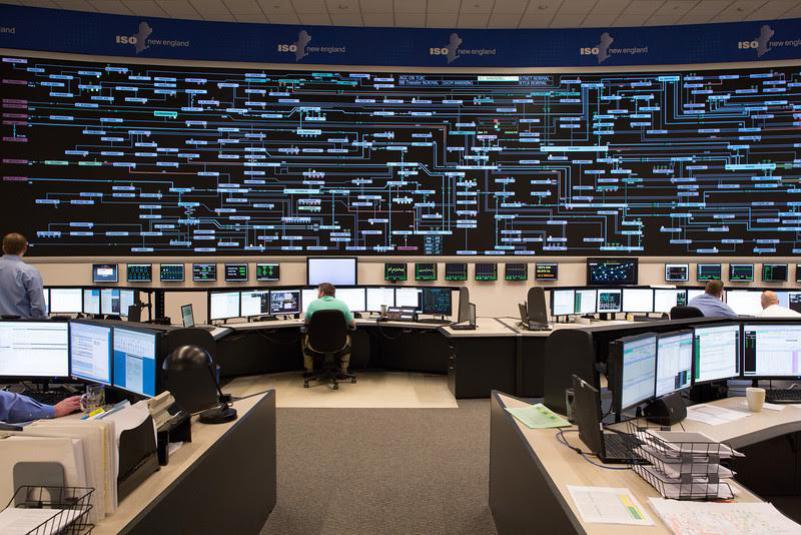
This makes things complicated for ISO-New England, the folks who regulate the 6-state power grid. Their job is to match demand and supply at all times, telling power plants to ramp up or turn off as needed. How are they supposed to know what’s happening with my panels or the other “behind-the-grid” photovoltaic in New England, which constitute about 3,200 megawatts of potential output, roughly three times Seabrook Station’s capacity.
As a result of solar and wind coming online, grid forecasting is dependent more than ever on weather forecasting – as this long press release from ISO-NE makes clear:
The new load-forecast models have been in place since March 2019. To fill in the dips in the daily load curves when solar panels are serving local load, a vendor provides the ISO with the historical output of 10,000 rooftop systems scattered around New England in five-minute increments. The data from that sampling of behind-the-meter PV systems is assumed to represent the actual performance of all PV in each town, under the actual weather conditions that existed in each town. The ISO then upscales the data from the smaller sample to approximate the output of all 180,000 BTM PV systems, arriving at the total regional PV output.
You can see why grid operators are nostalgic for the days when they could tell a small number of large power plants what to do, and that was mostly that.
 Return to the Concord Monitor
This is a great topic; thanks for your information. As more people move to heat pumps and electric vehicles, it will make the large-scale provision of regional electricity even more complex, or not.