
A year ago I looked at carbon-free electricity on the New England grid. I did it on a sunny Saturday morning in May, when demand is particularly low. About two-thirds was carbon free.
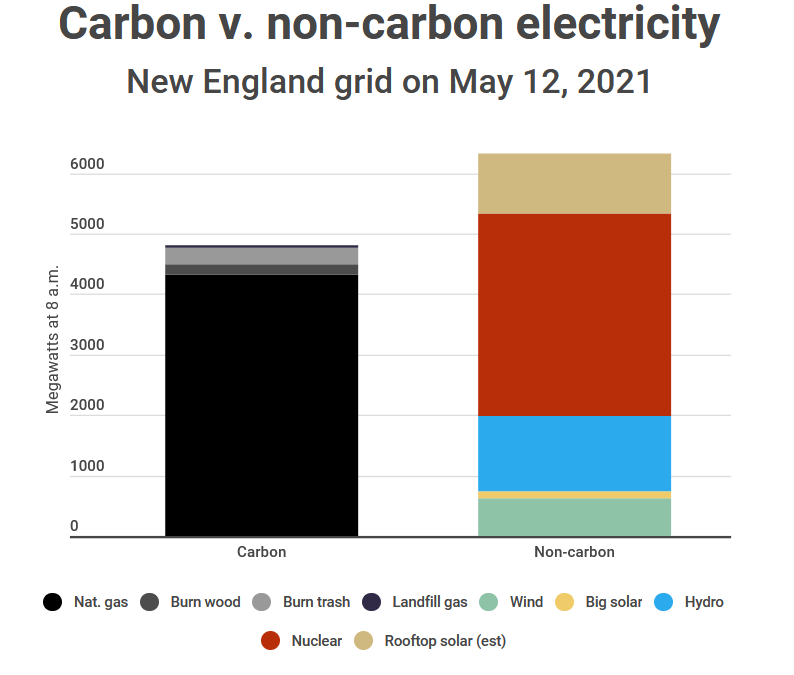
This morning I did it again on another sunny and breezy spring day, but this time a Wednesday when usage is greater. At 8 a.m., carbon-free power edges out the “burn stuff to make power” contingent. If I do this in the middle of the night, or when wind dies, the story would be much different.
This year also I added an estimate for rooftop solar throughout the six states. Distributed solar doesn’t show up directly on the real-time report by ISO-NE because it’s “behind the meter” – it only shows up as the reduced demand that produces the infamous duck curve.
ISO-NE says there’s more than 3000 MW of rooftop solar in New England. The utility solar production at 8 a.m. was about half of its maximum but I figured it’s more efficient than scattered rooftop installations, so I estimated 1000 MW of rooftop. But nobody really knows how much there was, which is one one of the things that makes life complicated for the grid these days.
Imagine what this chart would look like if 700 MW Vineyard Wind was already producing. Much better! Now imagine what it would look like if Seabrook Station was shut down. Much worse!
Note that ISO-NE divide electricity fuel sources into renewable and other, but “renewable” includes burning wood, burning trash and burning landfill gas for power, while “other” includes hydropower and nuclear.
 Return to the Concord Monitor