
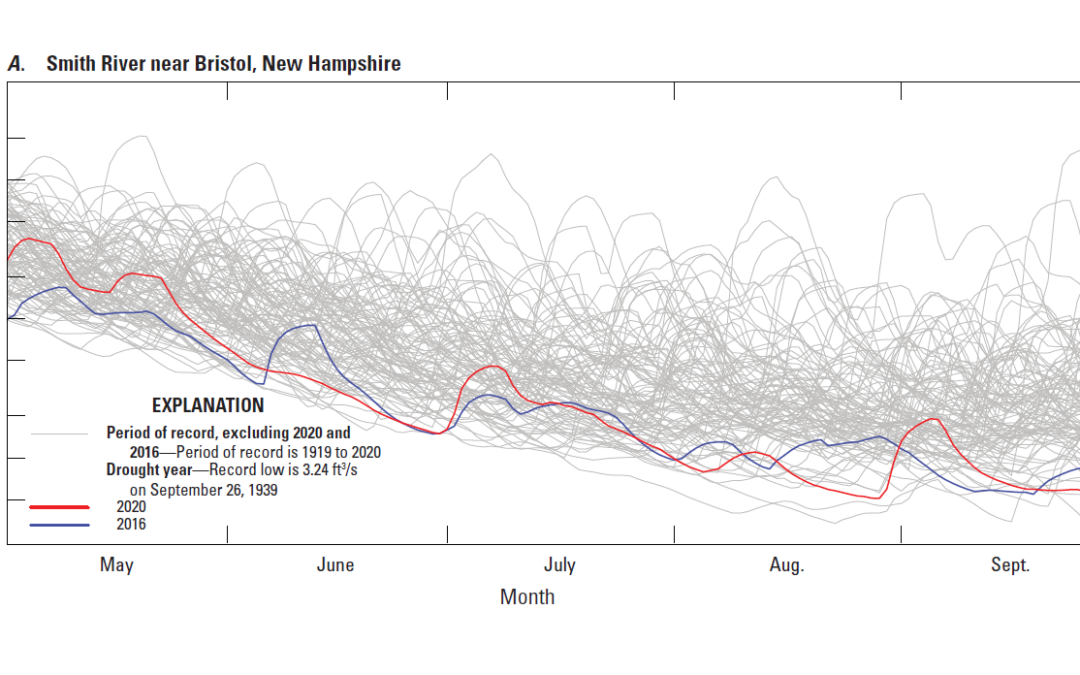
As New Hampshire teeters on the edge of another drought (most of the state is “abnormally dry” right now), the above graphic shows what led us here: 2020 was really dry.
This is chart of the flow rate of Smith River in Bristol over the course of spring and summer. The gray lines show the history dating back to 1919 (wow!), with red showing what happened last year, and blue the almost-as-dry 2016.
It comes from a U.S. Geological Survey publication about the drought, which you can read here.
 Return to the Concord Monitor