
As I have mentioned several times in this blog, I take daily measurements of precipitation at my house as part of the citizen-science group CoCoRaHS (Community Collaborative Rain Hail Snow network). Every October it gathers yearly data for all the observers (more than 10,000 of them). They do it in October because that’s the traditional breaking point of the 12-month “water year” for meteorology measurements.
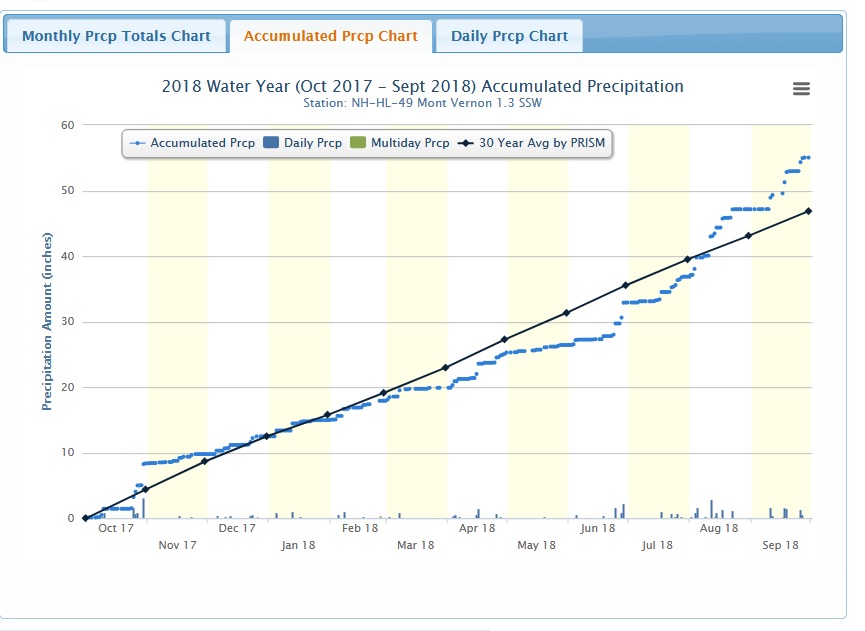
This chart shows my water year, and tells the story we all remember: It got dry at the end of winter, stayed very dry through mid-July, and has been wet as all get-out since then.
That 30-year-average, by the way, isn’t exact because I’ve only been collecting data for 8 years. It’s an estimate based on my data and other data from the state.
 Return to the Concord Monitor