
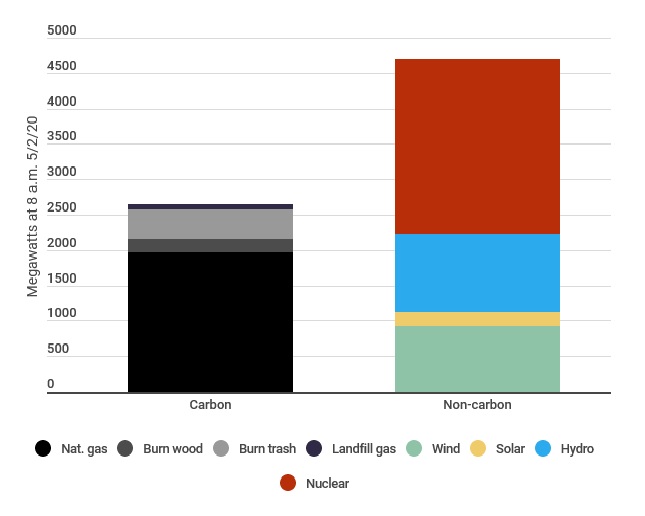
ISO-New England, the folks who run the six-state power grid, divide electricty fuel sources into two categories: Renewable and other.
That makes sense for some things but not if you’re interested in the grid’s carbon output. The trouble is that “renewable” includes burning wood, burning trash, and burning landfill gas for power, while “other” includes hydropower and nuclear.
On Saturday morning, when it was windy and sunny and total demand was low because it’s a weekend during the COVID lockdown, I re-arranged the sources, as shown in the chart above. About two-thirds of the electricity being put on the grid was carbon-free! Nuclear power really makes the difference even though we’ve only got three units operating in the region. it’s been like that for much of the late morning and early afternoon.
To an extent the imbalance is even greater because these numbers do not include rooftop solar like mine, which is behind the meter. That PV power shows up on ISO-NE’s count as lower demand rather than higher output and helps explain why, combined with demand reduction during the lockdown, electricity demand in New England hit possibly record-low levels on recent weekends, dipping down almost to 8,100 MW.
If you want to play with this stuff – it’s lots of fun – there are real-time charts at https://www.iso-ne.com/isoexpress/web/charts
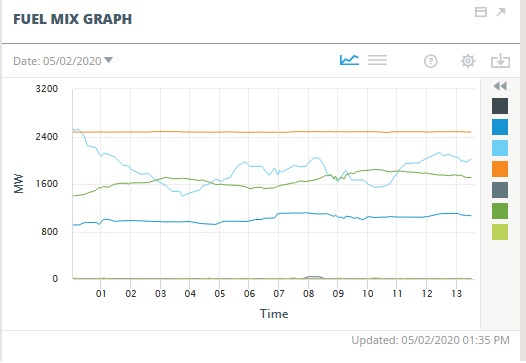
By the way, ISO’s renewables outpaced natural gas a couple times today, as the 24-hour chart shows – green is renewables, blue natural gas:
 Return to the Concord Monitor