
If only greenhouse gases were fabric dyes, it would be a lot easier to limit climate change.
I say that because of stories I’ve heard from old-timers who tell of the days before New England’s textile industry moved south, when you could guess what was being done in the local factory by looking at the color of the local river.
Everybody used rivers as sewers back then – “the solution to pollution is dilution!” – so each day’s dye would end up floating downstream. If the water was red, the factory was working on blankets; if it was green, towels; white, shirts; and so on.
That kind of visually obvious pollution prodded us to create the Clean Water Act and other environmental successes. But for climate change, there’s no in-your-eyeball equivalent to prod our action.
We can’t see the CO2 or methane or NO2 produced by our cars and boilers and AC units and lawnmowers, so it’s hard to know how much damage we’re doing and how much improvement we’ve made.
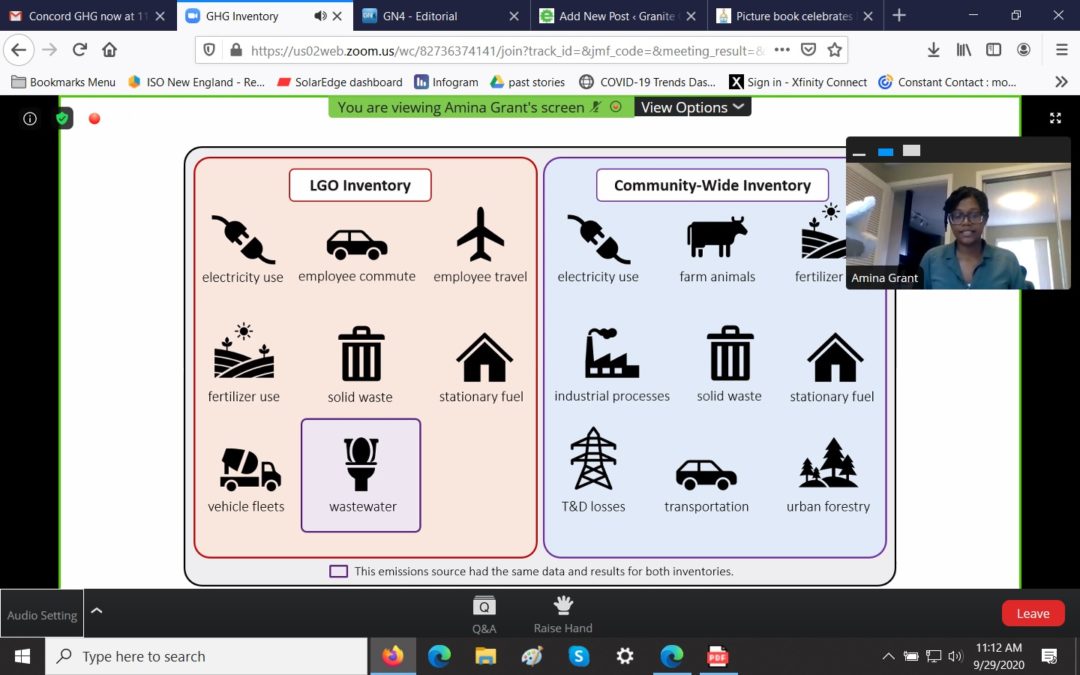
That’s why folks in Concord hired Amina Grant, a Ph.D. student in civil and environmental engineering at the University of Iowa, to put together a “carbon footprint” to guide efforts to meet the city’s climate and energy goals.
The result is full of conclusions like the fact that in 2019 Concord produced “495,905 metric tons of carbon dioxide equivalent,” of which 50% came from the commercial sector, 48% from the residential sector, and just 2% from local government operations. Fuel used to heat and cool buildings was the largest source of emissions (35%), followed by transportation fuel (28%), electricity use (18%), and industrial processes (15%).
That’s useful stuff for setting priorities, but I had to wonder: Short of putting a balloon on every exhaust pipe in town, how do you measure this stuff?
So I called up Grant and got her to walk me through the process.
“It’s not always easy,” she said. I believe it.
To start with, know that this was a database exercise. Because of COVID-19 restrictions, Grant couldn’t come to New Hampshire, so she compiled this information from a host of sources. Some were as exact as Liberty Utility’s data on natural gas purchases within the city or local government’s electricity usage, but most were estimates based on combining one or more sources.
Transportation emissions, for example, were estimated based on vehicles registration data combined with state and regional data on average mileage unless she could get something more specific: For public school buses, Grant was able to apply vehicle mileage.
Or consider emissions for heating homes. That varies depending on house size, who lives there, and whether they use gas, heating oil, kerosene, wood pellets or something else. Ideally you’d knock on every door in town and get these details but that would take a long time, be very expensive, and isn’t feasible in the pandemic.
“We didn’t have time for a local survey. The next step is the American Community Survey,” said Grant. That survey is sent to random households all year long by the Census Bureau, asking questions that used to be asked on the every-10-year census, including the fuel used for building heat.
So Grant extrapolated those answers to make estimates for the city as a whole, factoring in building characteristics and demographic data, then multiplied with industry standards about emissions from average heating units to get an estimate.
If Concord homes have much more efficient heating units than normal then it’s an over-estimate; if we’re more cold-sensitive than other parts of New England and keep the thermostat cranked, then it’s an under-estimate. But even if it’s off by a lot, it’s a decent point by which to measure future improvement. It guides such things as the relative importance in overall emissions of shifting homes to electric heat pumps.
Grant pointed out that estimating pollution without direct measurement is not a new problem. Researchers and industrial engineers and regulators have been tackling it for many decades and have developed techniques that she made liberal use of.
She said she used online sources such as the EPA’s government inventory tool, free on its website, and the World Bank’s CURB (“climate” and “urban”) tool, which can estimate current and future emissions from cities.
“A lot of greenhouse emission inventories rely on standard protocols that have been around at least 5 to 10 years, like local government operations protocol, national and international protocols that cities can follow to track their emissions,” she said.
Her biggest regret, she said, is that she had no way to factor in “fugitive emissions” that leak from pressurized equipment. They can be a real problem especially with refrigeration units, which use extremely potent greenhouse gases.
Grant said everybody realizes that these estimates are only a starting point. Feet on the ground are always better.
“I followed to a T standard protocols but they use a lot of top-down approaches. If they could get a lot of input, maybe by citizen science going by talking to individuals … to businesses … and getting a bottom-up approach to calculating these emissions, it would be much more accurate,” she said.
Many cities, including Concord, have started with energy audits to get a better handle on the situation. Grant said her university in Iowa is working with private companies to do such audits there.
“Trying to do a bottom-up approach is just very, very important, which is where Concord is moving,” she said. “You can figure out who has largest buildings, who is doing the largest consumption, who can work toward decreasing emissions. That helps figure out which sources need to be focused on the most, and which sectors require attention.”
 Return to the Concord Monitor