
Solar and wind accounted for about 7% of the electricity produced by generators within New England in 2022, according to ISO-New England, which oversees the six-state power grid. Solar was about 3.4% of the total and wind about 3.8% but solar is growing much faster.
The figure doesn’t include electricity imported from Canada (mostly Quebec) and New York, a small portion of which came from solar and wind plants. Imports made up about one-seventh of New England’s annual power needs.
You can see all the data here.
The solar tally comes from 3,600 MW of solar power plants, so-called utility solar, and does not include power from the roughly 5,000 MW of rooftop (behind-the-meter) solar that ISO-NE estimates has been installed throughout New England. (By the way, 0.000001% of that is mine!) ISO-NE doesn’t get direct data on BTM solar production – that’s what behind-the-meter means – but will be releasing an estimate of total rooftop production over the course of 2022 after some more number-crunching.
Looking at past annual reports shows that utility solar has been growing pretty fast. These figures give the annual GwH output:
- 2022 – 3,607 (about 3.4% of total power generation within the region, not including imports)
- 2021 – 2669
- 2020 – 2,079
- 2019 – 1,668
- 2018 – 1,233 (about 1.2% of total generation within the region)
and to complete the comparison, let’s go back a decade:
- 2012 – 36 (about .03% of total generation – and about 1/100th of the output from coal plants that year, before they started shutting down)
So New England’s utility solar plants have tripled annual electricity output over the past five years, and increased it 100-fold in a decade. It’s still pretty minor, though – hydropower is twice as productive. (Note that 2022 data is still preliminary.)
Rooftop solar is harder to get data on. Assuming that rooftop solar is (at a wild guess) 2/3 as efficient as utility solar because it’s not placed as well, the estimated production from panels like mine would be 3% to 4% of New England’s total power production. Nothing to sneeze at, but there’s still a long, long way to go.
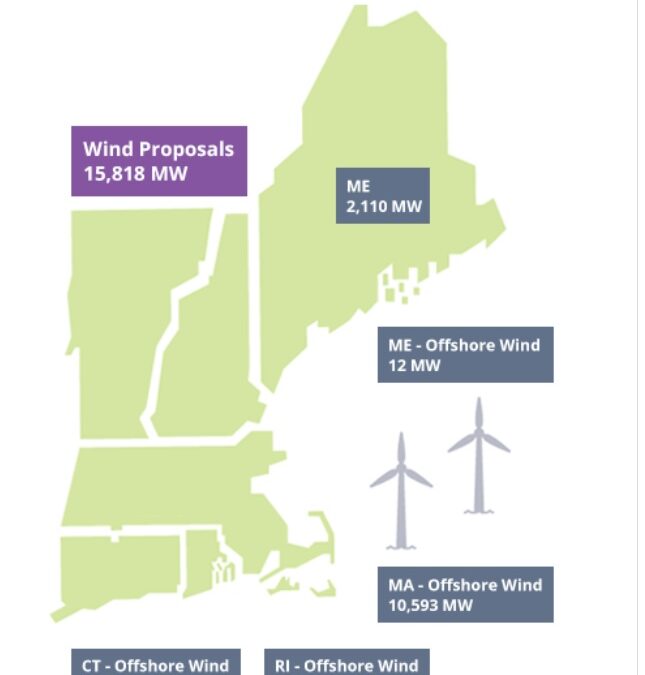
As for wind power, it hasn’t grown much lately – from 3,374 GwH in 2018 to 3,874 in 2022 – thanks to opposition to wind farms. Can’t wait for offshore wind!
Fossil gas continues to dominate the region’s power plants – 47% of the total – with nuclear second at 23%. Coal from our one power plant was just 1/3 of 1% of total production, while oil, mostly used to replace natural gas during cold snaps, was 2% of the total.
The least impressive but most hopeful category is “price-responsive demand” – just 0.04% of total output. This is demand-response and similar efforts that use the intelligent grid to reduce demand when needed rather than struggling to increase supply. That’s the future, folks.
 Return to the Concord Monitor