
ADDENDUM: This article’s data is from the state economic analysis; Ken Johnson, UNH’s demographics guru, says federal Census Bureau estimates indicate we’re still slightly (50.1%) female – that’s a lower percentage than any other New England state or the country as a whole. He’s unsure why.
In 2023 I noted an unusual fact about New Hampshire’s tepid population growth: Through 2021 we were gaining more males than females.
I called this shift surprising because males in the US have higher death rates than females for many reasons and it’s not like the gender ratio of births has altered. New Hampshire’s population growth these days is due entirely to in-migration, so it seems either than more men than women are moving here, presumably for jobs, or more women than men are moving away, also presumably for jobs.
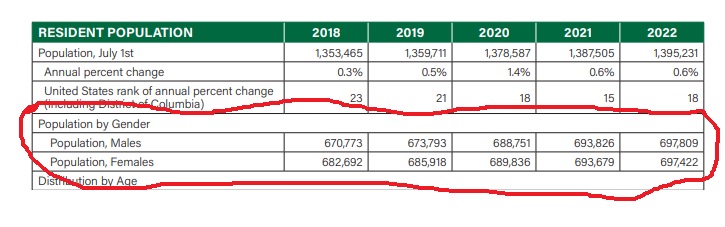
I just checked the data for 2022, the most recent available, and the trend has continued. In fact, for the first time in recent memory, state estimates say New Hampshire has more men than women, as you’ll see from the above chart. (The chart says we were majority male in 2021 as well, which I didn’t report previously because when I wrote that earlier piece the data said otherwise by a slim margin. In demographic figures, numbers are often tweaked after publication as new data trickles in.)
This is quite a change. In 2000, for example, women outnumbered men in New Hampshire by about 5%, which is a lot. I don’t have data for earlier years so perhaps we’ve never been majority male before.
What does this mean? I have no idea – but it’s interesting!
This chart comes from Vital Signs, the state’s annual publication of economic, demographic and other data about New Hampshire.
 Return to the Concord Monitor
Wish this source had collected (or shown) the male/female numbers in each age range. That would perhaps given a clue to the reasons for the anomaly .