by David Brooks | Nov 4, 2015 | Blog
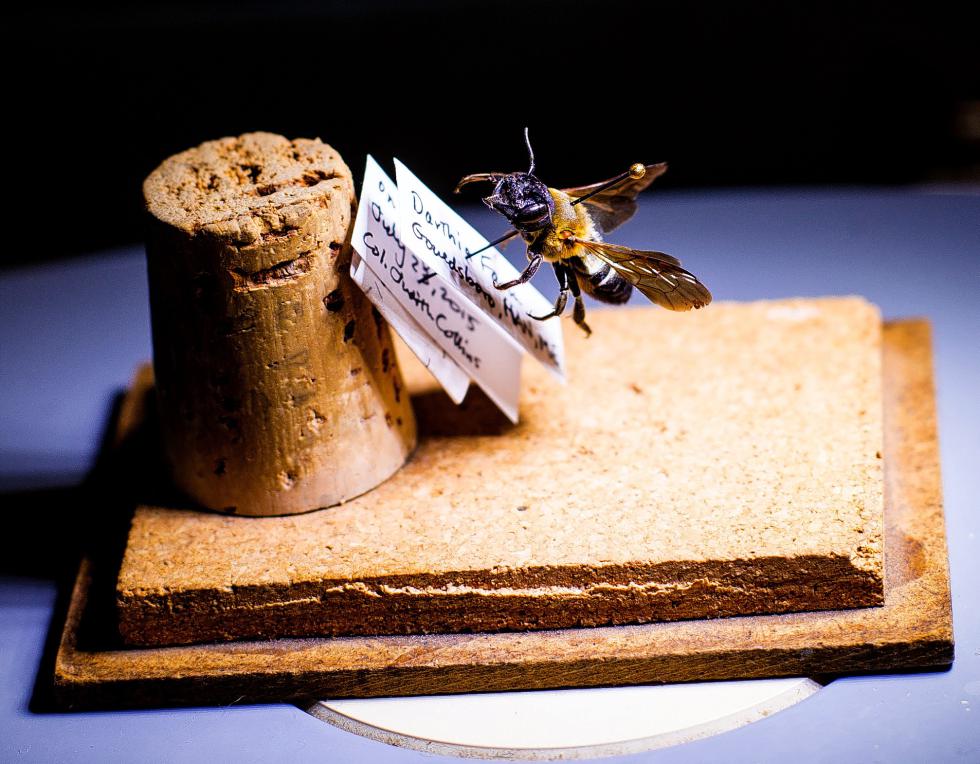
In response to an article I wrote about a New Hampshire pollinator conference on Monday, I was notified by a reader about an interesting Canadian company that has developed a system which it claims will let wild bees deliver precise amounts of pesticide or other...
by David Brooks | Nov 4, 2015 | Computers-Digital Devices, Science-Technology
If you’ve ever watched TV in a noisy bar and appreciated the closed captioning, you were benefiting from a technology developed to help people with disabilities. That is exactly what will happen if more technology to aid people with disabilities appears in the...
by David Brooks | Nov 3, 2015 | None, Science-Technology
Confession is good for the soul, they say, so let me confess some apiary sins: Three times over the past decade, my family beehive has failed to survive the winter. That’s at least 100,000 insects who have gone to meet their maker under the Brooks family watch....
by David Brooks | Nov 2, 2015 | Blog
A story on the Boston Globe, part of its specialty Stat publication, tells of a pushback by some doctors against the anti-vaccination movement: More than 20 percent of pediatricians “always” or “often” turn away families who decline to get their babies vaccinated,...

by David Brooks | Nov 2, 2015 | Blog
The above chart shows my measurements during the “water year” of Oct. 1 through Oct. 1 (an arbitrary period used by meteorologists to analyze precipitation). I make measurements as part of CoCoRaHS, a regional citizen-science precipitation-gathering group....

 Return to the Concord Monitor