
From ISO New England: (whole release is here)
On a sunny, mild Sunday afternoon last spring, demand for electricity from the region’s power grid fell to the lowest level ever seen by ISO New England’s system operators.
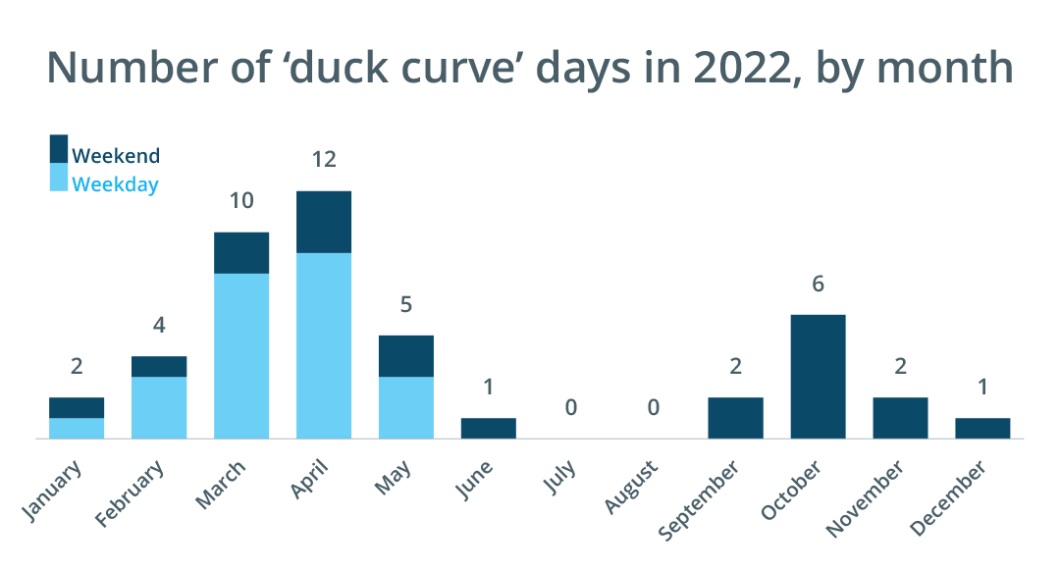
May 1 was a day for the record books, but it was also one of 45 times in 2022 when demand for grid electricity was lowest during the day instead of at night. These “duck curve” days—when a line chart representing grid demand resembles the silhouette of a duck—occur when behind-the-meter photovoltaic (BTM PV) installations significantly reduce the amount of electricity homes and businesses draw from the grid. This means less generation is needed from grid-connected resources, including power plants that run on natural gas, oil, and coal. The ISO first observed the phenomenon on April 21, 2018, and it happened 34 more times through the end of 2021.
The fact that the 2022 count exceeded the total for the previous four years combined points to the growing contribution of BTM PV to New England’s energy mix—particularly in the spring, when solar production is at its strongest. The ISO estimates that on May 1, 2022, BTM PV supplied more than 4,000 megawatts (MW) of electricity during the afternoon hours, as demand for electricity from the grid dropped below 7,600 MW.
The first duck curve day in 2022 occurred on January 16, and the last was on December 25. Daytime demand minimums were recorded at least once each month except for July and August, when the use of air conditioning typically pushes demand to the highest levels of the year and summer heat reduces the efficiency of solar panels. Duck curves also occurred on each day of the week, with just over half recorded on weekdays.
There have already been a half-dozen duck curve days in 2023, with the first falling on January 8.
 Return to the Concord Monitor
How does heat reduce solar panel efficiency?
Also, how in the world can a curve look like a duck? I am struggling to imagine that.
Visual-Stats: it is not a duck, just a duck bill. Normal bell curve is a camel hump perfectly in the middle. This misnomer is a duck bill with the hump or a bill to the left and a long thin beak to the right. Perhaps, that is why some stat gurus are quacks!
Zooologically-themed data analysis is a growing field.
Haha! Still can’t see the duck ( or it’s bill).